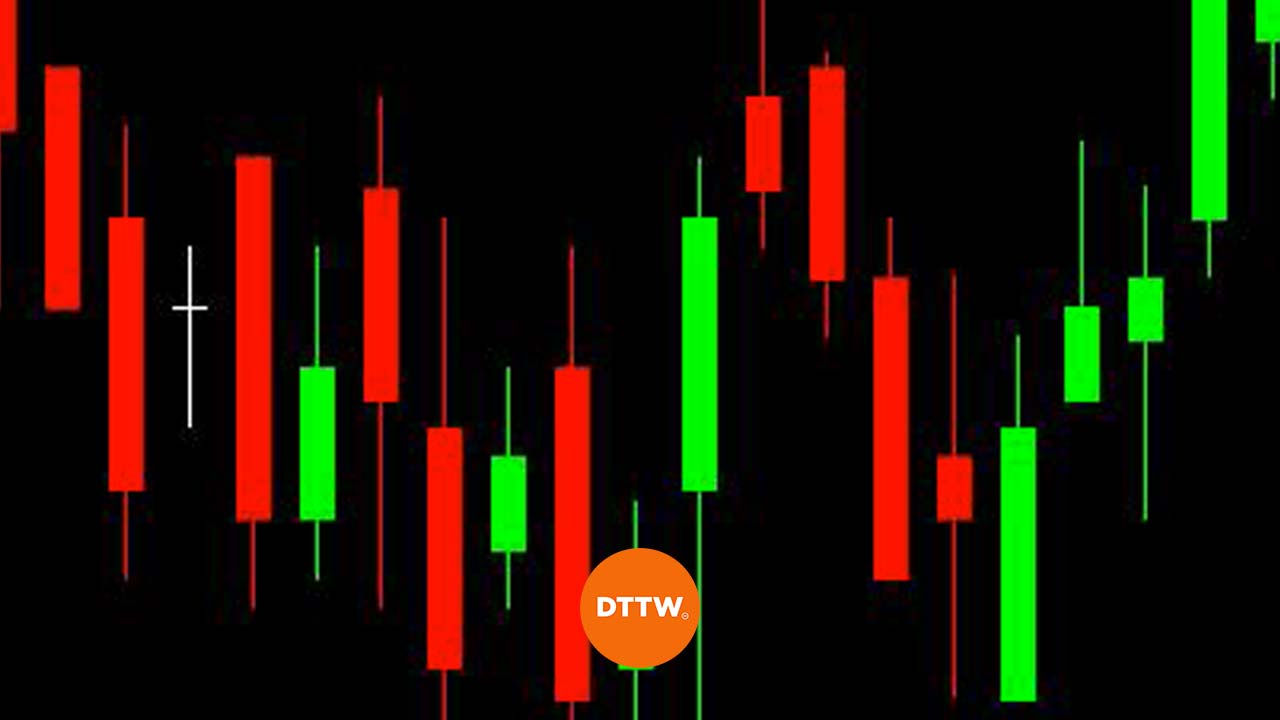
Learn with ETMarkets: How to master candlestick patterns to decipher price action in gold and silver?
Candlestick charts are a cornerstone of technical analysis, providing a visually intuitive way to understand price movements in the MCX ...

Candlestick charts are a cornerstone of technical analysis, providing a visually intuitive way to understand price movements in the MCX ...
Nifty on Tuesday ended 95 points higher to cross above the key hurdle at 19,850 level and form a hammer ...
There are several types of charts that you can use in the financial market. What is not known well by ...
Candlesticks are the most popular charts used in the financial market because they provide more data compared to other types ...


Get the latest news and follow the coverage of Business & Financial News, Stock Market Updates, Analysis, and more from the trusted sources.