Updated on July 27th, 2025 by Nikolaos SismanisWith contributions from Ben Reynolds
Spreadsheet data updated daily
Master Limited Partnerships – or MLPs, for short – offers
Tax-advantaged income
High yields well in excess of market averages
The bulk of corporate cash flows returned to shareholders through distributions
An example of a typical MLP is an organization involved in the midstream energy industry.
Midstream energy companies are in the business of transporting oil, primarily though pipelines
Pipeline companies make up the vast majority of MLPs
Since MLPs typically offer high yields, they are naturally appealing for income investors.
With this in mind, we created a full downloadable list of over 60 MLPs.
You can download the Excel spreadsheet (along with relevant financial metrics like dividend yield and payout ratios) by clicking on the link below:

This comprehensive research report covers MLPs in depth, including our top 10 best MLPs today based on expected total returns.
Table Of Contents
The History of Master Limited Partnerships
MLPs were created in 1981 to allow certain business partnerships to issue publicly traded ownership interests.
The first MLP was Apache Oil Company, which was quickly followed by other energy MLPs, and then real estate MLPs.
The MLP space expanded rapidly until a great many companies from diverse industries operated as MLPs – including the Boston Celtics basketball team.
One important trend over the years, is that energy MLPs have grown from being roughly one-third of the total MLP universe to containing the vast majority of these securities.
Moreover, the energy MLP universe has evolved to be focused on midstream energy operations.
MLP Tax Consequences
Master limited partnerships are tax-advantaged investment vehicles. They are taxed differently than corporations. MLPs are pass-through entities. They are not taxed at the entity level.
Instead, all money distributed from the MLP to unit holders is taxed at the individual level.
Distributions are “passed through” because MLP investors are actually limited partners in the MLP, not shareholders. Because of this, MLP investors are called unit holders, not shareholders.
And, the money MLPs pay out to unit holders is called a distribution (not a dividend).
The money passed through from the MLP to unit holders is classified as either:
Return of Capital
Ordinary Income
MLPs tend to have lots of depreciation and other non-cash charges. This means they often have income that is far lower than the amount of cash they can actually distribute. The cash distributed less the MLPs income is a return of capital.
A return of capital is not technically income, from an accounting and tax perspective. Instead, it is considered as the MLP actually returning a portion of its assets to unit holders.
Now here’s the interesting part…
Returns of capital reduce your cost basis.
That means taxes for returns of capital are only due when you sell your MLP units. Returns of capital are tax-deferred.
Note: Return of capital taxes are also due in the event that your cost basis is less than $0. This only happens for very long-term holding, typically around 10 years or more at a minimum.
Each individual MLP is different, but on average an MLPs distribution is usually around 80% to 90% a return of capital, and 10% to 20% ordinary income.
This works out very well from a tax perspective. The images below compare what happens when a corporation and an MLP each have the same amount of cash to send to investors.
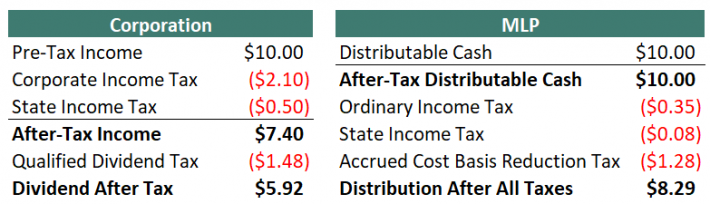
Note 1: Taxes are never simple. Some reasonable assumptions had to be made to simplify the table above. These are listed below:
Corporate federal income tax rate of 21%
Corporate state income tax rate of 5%
Qualified dividend tax rate of 20%
Distributable cash is 80% a return of capital, 20% ordinary income
Personal federal tax rate of 22% less 20% for passive entity tax break(19.6% total instead of 22%)
Personal state tax rate of 5% less 20% for passive entity tax break(4% total instead of 5%)
Long-term capital gains tax rate of 20% less 20% for passive entity tax break(16% total instead of 20%)
Note 2: In the MLP example, the accrued cost basis reduction tax is due when the MLP is sold, not annually come tax time.
As the tables above show, MLPs are far more efficient vehicles for returning cash to shareholders relative to corporations.
Additionally, in the example above $9.57 out of $10.00 distribution would be kept by the MLP investor until they sold because the bulk of taxes are from returns of capital and not due until the MLP is sold.
Return of capital and other issues discussed above do not matter when MLPs are held in a retirement account.
There is a different issue with holding MLPs in a retirement account, however. This includes 401(k), IRA, and Roth IRA accounts, among others.
When retirement plans conduct or invest in a business activity, they must file separate tax forms to report Unrelated Business Income (UBI) and may owe Unrelated Business Taxable Income (UBTI). UBTI tax brackets go up to 37% (the top personal rate).
MLPs issue K-1 forms for tax reporting. K-1s report business income, expense, and loss to owners. Therefore, MLPs held in retirement accounts may still qualify for taxes.
If UBI for all holdings in your retirement account is over $1,000, you must have your retirement account provider (typically, your brokerage) file Form 990-T.
You will want to file form 990-T as well if you have a UBI loss to get a loss carryforward for subsequent tax years. Failure to file form 990-T and pay UBIT can lead to severe penalties.
Fortunately, UBIs are often negative. It is a fairly rare occurrence to owe taxes on UBI.
The subject of MLP taxation can be complicated and confusing. Hiring a tax professional to aid in preparing taxes is a viable option for dealing with the complexity.
The bottom line is this: MLPs are tax-advantaged vehicles that are suited for investors looking for current income. It is fine to hold them in either taxable or non-taxable (retirement) accounts.
Since retirement accounts are already tax-deferred, holding MLPs in taxable accounts allows you to ‘get credit’ for the full effects of their unique structure.
4 Advantages & 6 Disadvantages of Investing in MLPs
MLPs are a unique asset class. As a result, there are several advantages and disadvantages to investing in MLPs. Many of these advantages and disadvantages are unique specifically to MLPs.
Advantages of MLPs
Advantage #1: Lower taxes
MLPs are tax-advantaged securities, as discussed in the Tax Consequences section above. Depending on your individual tax bracket, MLPs are able to generate around 40% more after-tax income for every pre-tax dollar they decide to distribute, versus Corporations.
Advantage #2: Tax-deferred income through returns of capital
In addition to lower taxes in general, 80% to 90% of the typical MLPs distributions are classified as returns of capital. Taxes are not 0wed (unless cost basis falls below 0) on return of capital distributions until the MLP is sold.
This creates the favorable situation of tax-deferred income.
Tax-deferred income is especially beneficial for retirees as return on capital taxes may not need to be paid throughout retirement.
Advantage #3: Diversification from other asset classes
Investing in MLPs provides added diversification in a balanced portfolio. Diversification can be measured by the correlation in return series between asset classes.
MLPs are excellent diversifiers, having either a near zero or negative correlation to corporate bonds, government bonds, and gold.
Additionally, they have a correlation coefficient of less than 0.6 to both REITs and the S&P 500. This makes MLPs an excellent addition to a diversified portfolio.
Source: Portfolio Visualizer
Advantage #4: Typically very high yields
MLPs tend to have high yields far in excess of the broader market. As of this writing, the S&P 500 yields ~1.0%, while the Alerian MLP ETF (AMLP) yields over 7.4%. And some individual MLPs have yields above 10%.
Disadvantages of MLPs
Disadvantage #1: Complicated tax situation
MLPs can create a headache come tax season. MLPs issue K-1’s and are generally more time-consuming and complicated to correctly calculate taxes than common stocks.
Disadvantage #2: Potential additional paperwork if held in a retirement account
In addition, MLPs create extra paperwork and complications when invested through a retirement account because they potentially create unrelated business income (UBI). See the Tax Consequences section above for more on this.
Disadvantage #3: Little diversification within the MLP asset class
While MLPs provide significant diversification versus other asset classes, there is little diversification within the MLP structure.
The majority of publicly traded MLPs are oil and gas pipeline businesses. There are some exceptions, but in general MLP investors are investing in energy pipelines and not much else.
Because of this, it would be unwise to allocate all or a majority of one’s portfolio to this asset class.
Disadvantage #4: Incentive Distribution Rights (IDRs)
MLP investors are limited partners in the partnership. The MLP form also has a general partner.
The general partner is usually the management and ownership group that controls the MLP, even if they own a very small percentage of the actual MLP.
Incentive Distribution Rights, or IDRs, are used to incentivize the general partner to grow the MLP.
IDRs typically allocate greater percentages of cash flows to go to the general partner (and not to the limited partners) as the MLP grows its cash flows.
This reduces the MLPs ability to grow its distributions, putting a handicap on distribution increases.
It should be noted that not all MLPs have IDRs, but many do.
Disadvantage #5: Elevated risk of distribution cuts due to high payout ratios
One of the big advantages of investing in MLPs is their high yields. Unfortunately, high yields very often come with high payout ratios.
Most MLPs distribute nearly all of the cash flows they make to unit holders. In general, this is a positive.
However, it creates very little room for error.
The pipeline business is generally stable, but if cash flows decline unexpectedly, there is almost no margin of safety at many MLPs. Even a short-term disturbance in business results can necessitate a reduction in the distribution.
Disadvantage #6: Growth Through Debt & Share Issuances
Since MLPs typically distribute virtually all of their cash flows as distributions, there is very little money left over to actually grow the partnership.
And most MLPs strive to grow both the partnership, and distributions, over time. To do this, the MLP’s management must tap capital markets by either issuing new units or taking on additional debt.
When new units are issued, existing unit holders are diluted; their percentage of ownership in the MLP is reduced.
When new debt is issued, more cash flows must be used to cover interest payments instead of going into the pockets of limited partners through distributions.
If an MLPs management team starts projects with lower returns than the cost of their debt or equity capital, it destroys unit holder value. This is a real risk to consider when investing in MLPs.
The 10 Best MLPs Today
The 10 best MLPs are ranked and analyzed below using expected total returns from the Sure Analysis Research Database. Expected total returns consist of 3 elements:
Return from change in valuation multiple
Return from distribution yield
Return from growth on a per-unit basis
Investors should note that the top MLPs list was not screened on a qualitative assessment of a company’s distribution risk. The focus is expected annual returns over the next five years.
That said, MLPs with current distribution yields below 2% were not considered. This screen makes the list more attractive to income investors.
Continue reading for detailed analysis of each of our top MLPs, ranked according to expected 5-year annual returns.
MLP #10: Plains GP Holdings, L.P. (PAGP)
5-year expected annual returns: 6.0%
Distribution yield: 6.3%
Plains GP Holdings, L.P. owns an indirect limited-partner interest in Plains All American Pipeline and a non-economic controlling interest in PAA’s general partner. PAGP therefore has no meaningful operating business separate from PAA.
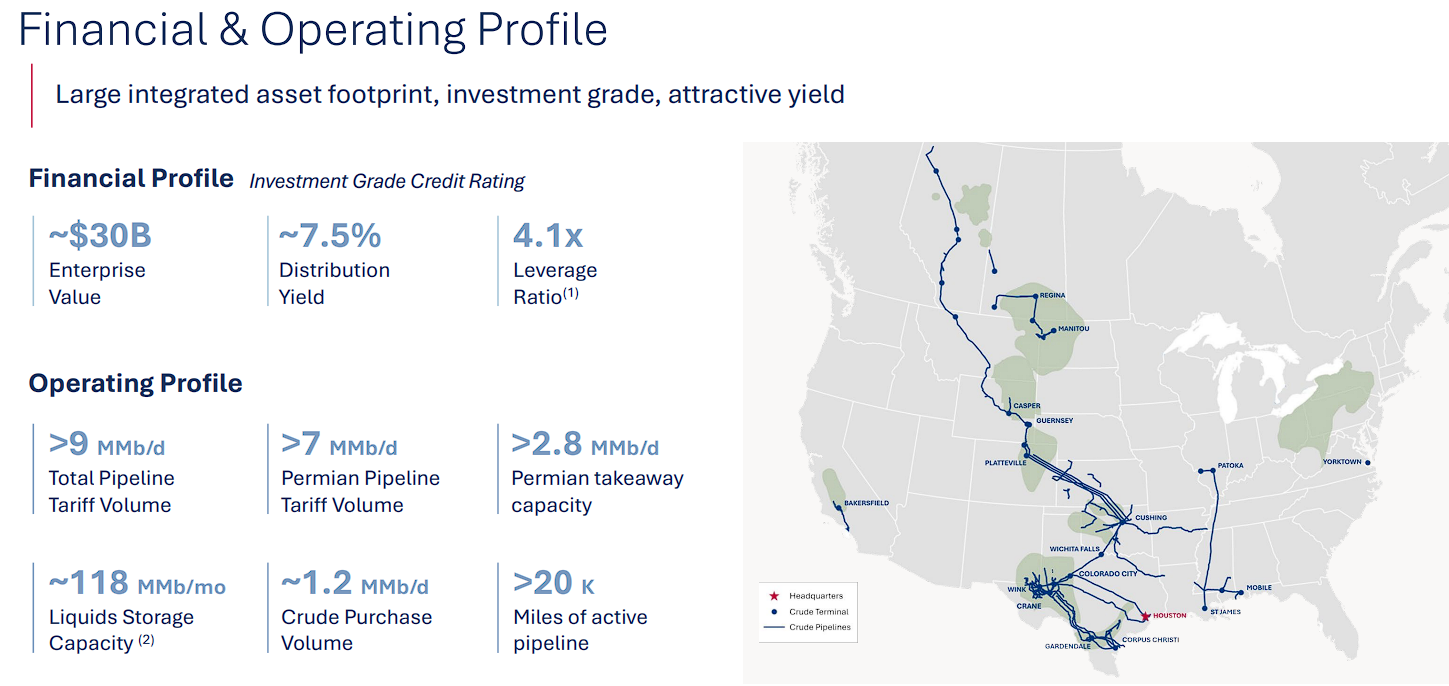
Its results and distributions are tied to the same crude-oil infrastructure platform, but its corporate structure and valuation can produce a different expected return.
In the first quarter of 2026, PAGP reported net income attributable to the partnership of $20 million, or $0.10 per Class A share.
The underlying PAA business generated $730 million of adjusted EBITDA attributable to PAA and $418 million of operating cash flow.
PAA also paid a quarterly distribution of $0.4175 per unit, equivalent to $1.67 annually, which is mirrored by PAGP.
Plains completed the sale of its Canadian NGL business to Keyera in May, receiving approximately $3.3 billion of net cash proceeds.
Management plans to use the proceeds primarily to repay debt, leaving the company focused on crude-oil gathering, transportation, and storage.
This should reduce commodity-price volatility and maintenance spending, although it also concentrates the business more heavily on North American crude volumes.
PAGP can be useful for investors who prefer its ownership structure, but buying both PAGP and PAA does not provide meaningful diversification.
Deep Dive: Click here to download (for free) our most recent 3-Page Sure Analysis PDF report on PAGP.
MLP #9: Sunoco LP (SUN)
5-year expected annual returns: 6.3%
Distribution yield: 5.3%
Sunoco LP distributes motor fuel through an extensive wholesale network and owns pipelines, terminals, retail sites, and refining assets.
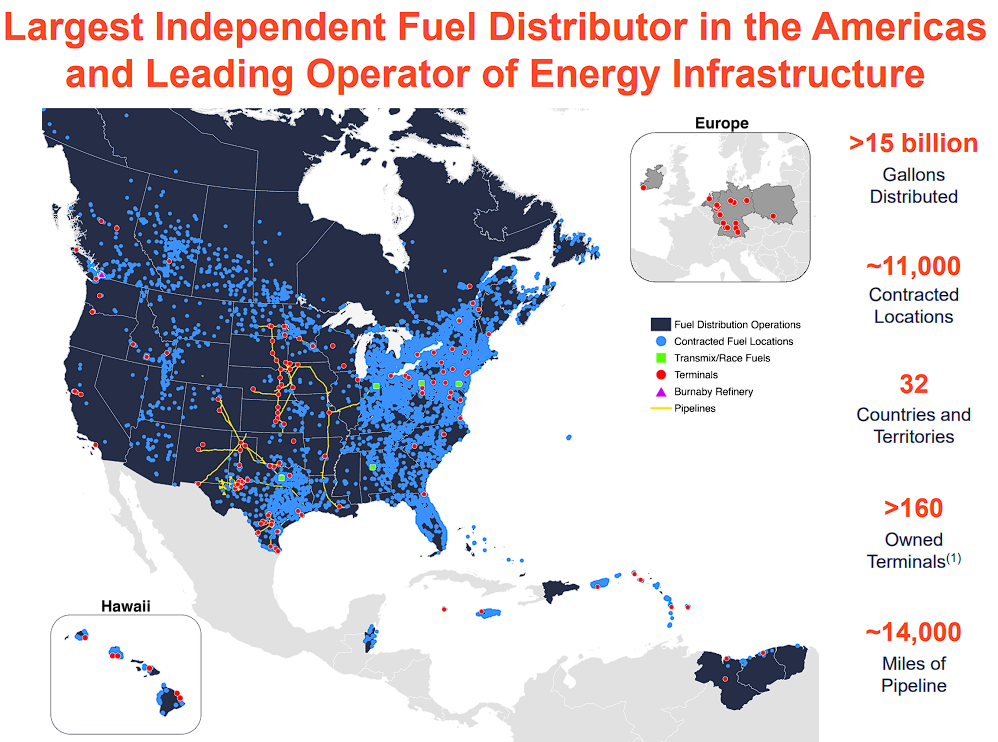
The partnership has become much larger and more diversified following its recent acquisitions, although fuel distribution remains the core source of cash flow.
Changes in fuel prices mostly pass through revenue and cost of sales, making margins and volumes more informative than headline sales.
First-quarter 2026 net income rose to $644 million from $207 million. Adjusted EBITDA was $858 million, compared with $458 million a year earlier, while adjusted distributable cash flow increased to $535 million from $310 million.
The quarter included a $102 million inventory-sale gain, so the year-over-year comparison overstates the improvement in recurring earnings.
Fuel Distribution adjusted EBITDA reached $529 million, and pipeline throughput averaged about 1.3 million barrels per day.
Sunoco raised its quarterly distribution 6.25% to $0.9899 per unit, bringing the year-over-year increase above 10%.
The enlarged platform, including the Parkland businesses and the completed TanQuid acquisition, should provide additional scale and synergy opportunities. However, integration remains a major execution test.
Long-term debt stood near $13.9 billion, and leverage was approximately 4.0 times at quarter-end, so successful deleveraging will be important as management pursues at least 5% annual distribution growth.
Deep Dive: Click here to download (for free) our most recent 3-Page Sure Analysis PDF report on SUN.
MLP #8: Star Group, L.P. (SGU)
5-year expected annual returns: 6.4%
Distribution yield: 5.9%
Star Group, L.P. distributes home heating oil and propane and provides HVAC services, primarily in the northeastern and mid-Atlantic United States.
Its earnings are highly seasonal and depend partly on winter temperatures. Acquisitions have helped offset customer attrition in the mature heating-oil market, while service revenue adds a more recurring element to the business.
For the fiscal second quarter ended March 31st, 2026, revenue increased 3.2% to $766.7 million. Home heating oil and propane volumes rose 0.4% to 144.5 million gallons as colder weather and acquired customers outweighed attrition.
Net income increased to $108.3 million from $85.9 million, partly because of favorable derivative movements.
Adjusted EBITDA offered a cleaner view and improved to $138.7 million from $128.2 million, including $2.1 million of additional contribution from acquisitions.
Star recently increased its annualized distribution by $0.05 to $0.79 per unit. The payout remains supported by strong winter cash generation, but quarterly results can move sharply with temperatures, fuel margins, and weather-hedge outcomes.
The longer-term challenge is the gradual decline of heating-oil use. Star must continue acquiring customers, improving margins, and expanding propane and service operations faster than its legacy customer base contracts.
Note that Star elected to be treated as a corporation for U.S. federal income-tax purposes despite retaining its partnership structure.
Deep Dive: Click here to download (for free) our most recent 3-Page Sure Analysis PDF report on SGU.
MLP #7: Enterprise Products Partners L.P. (EPD)
5-year expected annual returns: 7.6%
Distribution yield: 5.7%
Enterprise Products Partners L.P. is one of North America’s largest midstream partnerships.
Its network includes more than 50,000 miles of pipelines, over 300 million barrels of storage capacity, natural-gas processing facilities, export terminals, and petrochemical infrastructure.
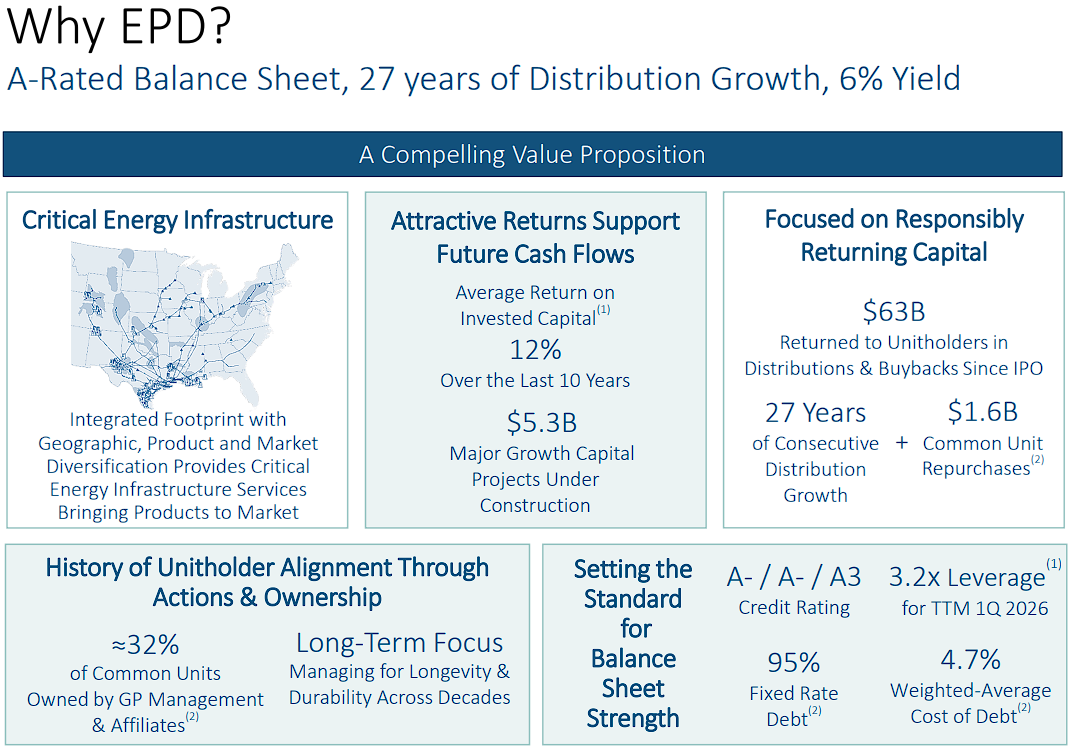
Most earnings come from fees linked to volumes rather than outright commodity-price exposure.
Enterprise reported first-quarter 2026 operating income of $1.9 billion, an increase of 8%. Net income attributable to common unitholders rose 6% to $1.5 billion, or $0.68 per diluted unit.
Adjusted EBITDA reached $2.69 billion, while operational distributable cash flow was $2.11 billion.
The quarterly distribution increased 2.8% to $0.55 per unit and remained covered by approximately 1.8 times. Enterprise also repurchased roughly $116 million of common units during the quarter.
The partnership is investing in a multibillion-dollar backlog centered on natural-gas processing, NGL transportation, storage, and export capacity.
These projects should increase fee-based cash flow as North American energy production and exports grow.
Enterprise’s integrated system, conservative payout, and retained cash flow make it one of the financially stronger MLPs in the group.
Its expected return ranks lower than several peers because the market already assigns the units a comparatively healthy valuation.
Project execution, construction costs, and changes in drilling activity remain the main issues to monitor.
Deep Dive: Click here to download (for free) our most recent 3-Page Sure Analysis PDF report on EPD.
MLP #6: Delek Logistics Partners, LP (DKL)
5-year expected annual returns: 8.7%
Distribution yield: 7.9%
Delek Logistics Partners, LP owns crude-oil, natural-gas, water, refined-product, and storage infrastructure.
Its assets support Delek US refineries and a growing group of third-party customers, with an expanding presence in the Midland and Delaware basins.
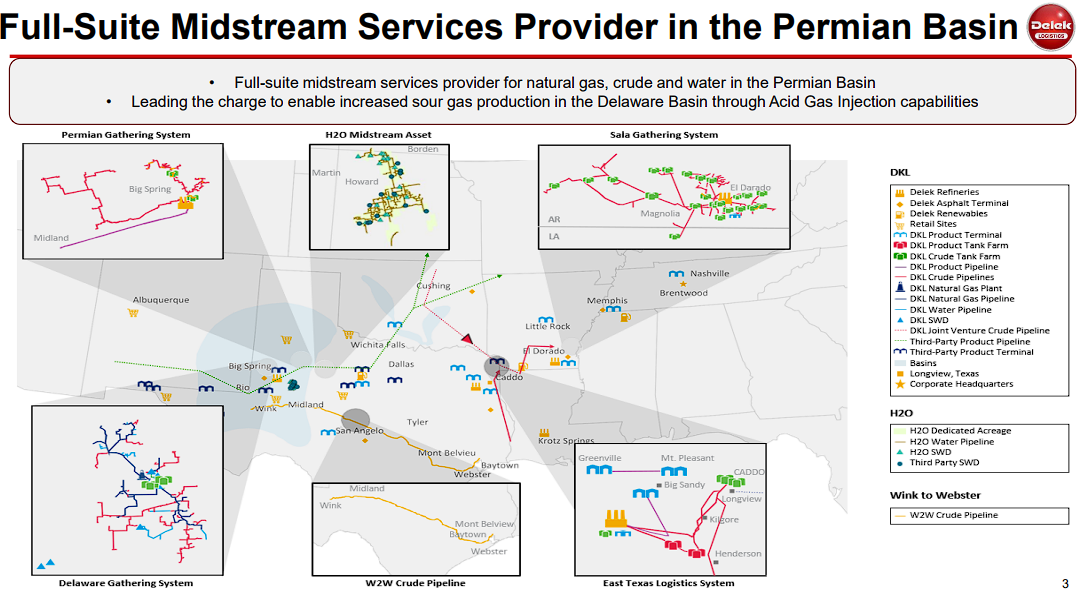
The partnership’s relationship with Delek US provides contracted business and acquisition opportunities, but it also creates meaningful sponsor concentration.
First-quarter 2026 net revenue increased 19% from the prior-year period, helped by the Delek Permian Gathering dropdown and stronger Delaware Gathering activity.
EBITDA increased to $94.9 million from $92.2 million. Net income declined to $32.4 million, or $0.60 per diluted unit, from $39.0 million, or $0.73 per unit, as higher depreciation and interest costs offset operating growth.
Distributable cash flow was nearly unchanged at $71.2 million.
Delek Logistics raised its quarterly distribution to $1.13 per unit, its latest small step higher.
Growth spending is focused on a broader crude, gas, and water offering in the Permian, including additional gas-treating and sour-gas capabilities.
New agreements with Delek US should improve economic separation and support third-party revenue, although the annual corporate-services fee rises by $8 million beginning in July 2026.
The high distribution is attractive, but leverage, interest expense, sponsor exposure, and acquisition discipline deserve close attention.
Deep Dive: Click here to download (for free) our most recent 3-Page Sure Analysis PDF report on DKL.
MLP #5: Plains All American Pipeline, L.P. (PAA)
5-year expected annual returns: 9.8%
Distribution yield: 6.8%
Plains All American Pipeline, L.P. owns crude-oil pipelines, gathering systems, terminals, and storage assets across major producing basins and market hubs in the United States and Canada.
Its Permian position is especially important. Following a major divestiture, Plains is now much closer to a pure-play crude-oil midstream partnership.
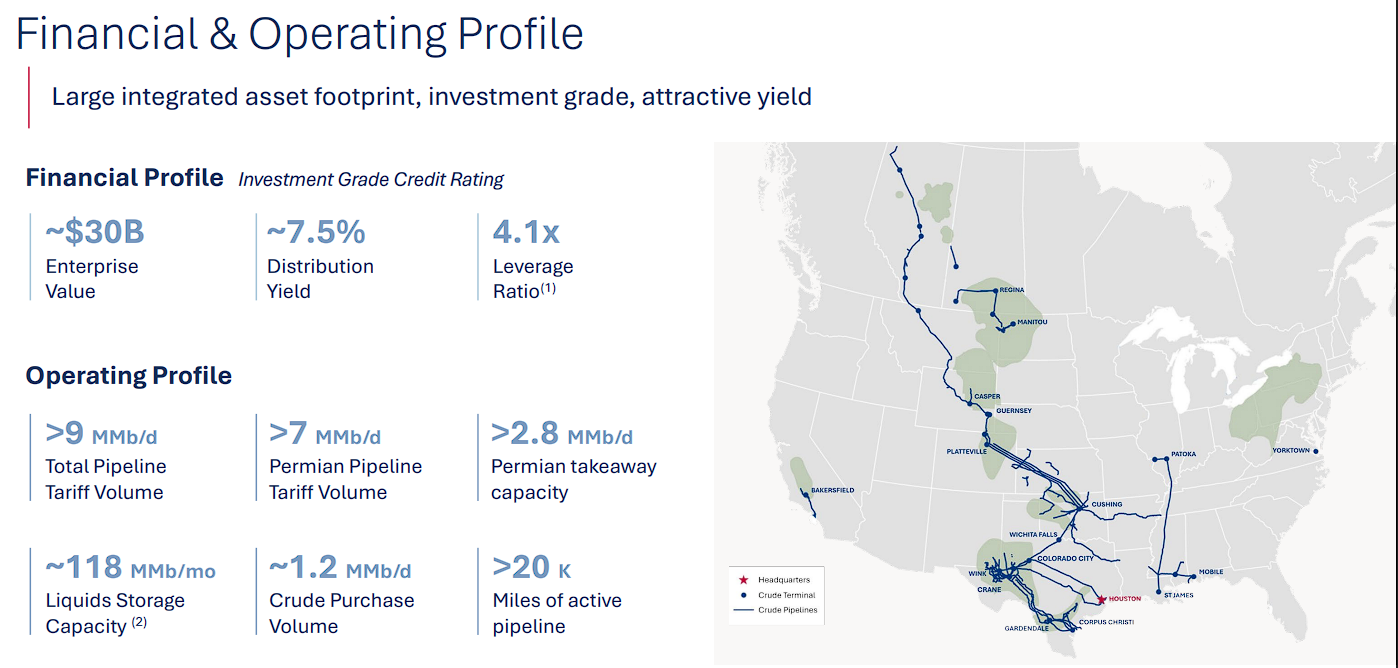
First-quarter 2026 net income attributable to PAA was $152 million, while adjusted net income was $325 million, or $0.39 per unit.
Adjusted EBITDA attributable to PAA declined 3% to $730 million, but crude-oil adjusted EBITDA increased 4% to $582 million as acquisitions and higher pipeline volumes offset contract-rate resets.
Management raised the midpoint of 2026 adjusted EBITDA guidance to $2.88 billion and increased adjusted free-cash-flow guidance to about $1.85 billion.
In May, Plains completed the sale of its Canadian NGL business to Keyera for approximately $3.3 billion of net proceeds.
Debt repayment should move leverage back toward management’s target range and leave a simpler business with lower commodity sensitivity and maintenance requirements.
The quarterly distribution of $0.4175 per unit was 10% higher than a year earlier.
Future growth will depend heavily on Permian volumes, tariff economics, and execution of Cactus III synergies. Also, note that PAA and PAGP represent exposure to essentially the same underlying business.
Deep Dive: Click here to download (for free) our most recent 3-Page Sure Analysis PDF report on PAA.
MLP #4: Hess Midstream LP (HESM)
5-year expected annual returns: 10.4%
Distribution yield: 7.7%
Hess Midstream LP owns gathering, processing, terminaling, and water infrastructure in North Dakota’s Bakken and Three Forks formations.
Long-term, fee-based contracts provide strong cash-flow visibility and limit direct commodity-price exposure.
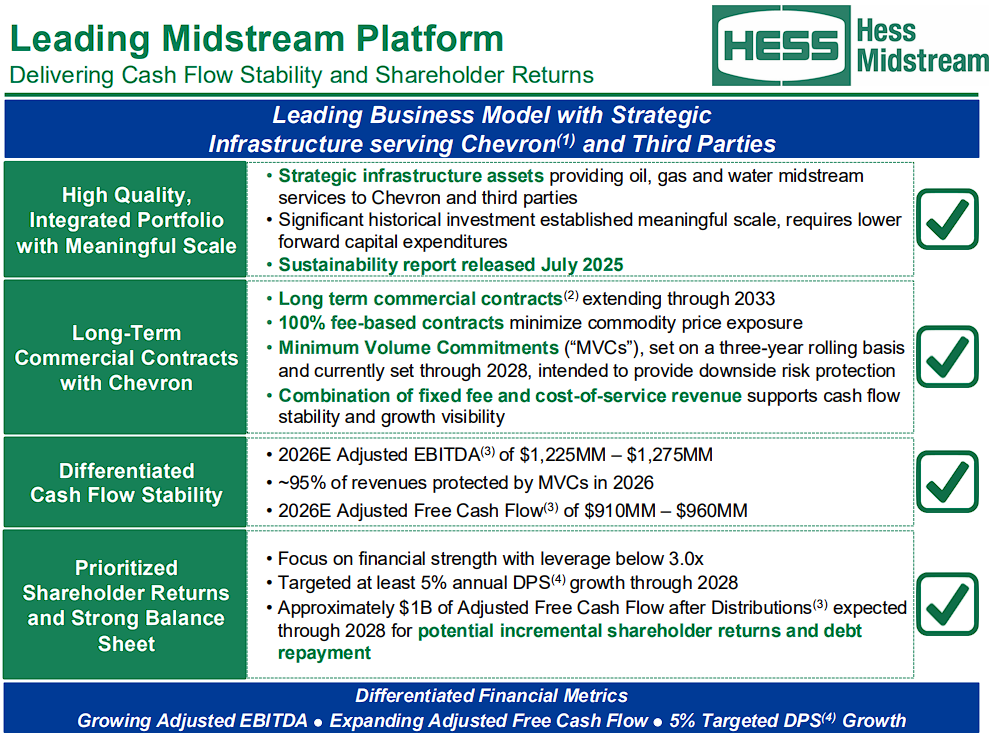
The tradeoff is concentration, since the platform remains closely tied to production associated with its principal customer and sponsor.
First-quarter 2026 revenue and other income increased to $390.1 million from $382.0 million. Net income was $157.7 million, and net income attributable to Hess Midstream was $87.6 million, or $0.68 per Class A share.
Adjusted EBITDA totaled $299.8 million, while adjusted free cash flow reached $237.0 million.
Oil-terminaling and water-gathering volumes declined as reduced new-well activity affected production, although gas-processing throughput increased 1% with help from third-party volumes.
Capital expenditures fell 79% to $10.4 million after the completion of a gas-compression expansion.
Lower spending and delayed cash taxes led management to raise 2026 adjusted free-cash-flow guidance to $910 million to $960 million.
The quarterly distribution increased to $0.7792 per share, and management continues to target at least 5% annual distribution growth.
Excess cash can fund additional repurchases and debt reduction, but the pace of Bakken development and the partnership’s customer concentration remain important risks.
Deep Dive: Click here to download (for free) our most recent 3-Page Sure Analysis PDF report on HESM.
MLP #3: Brookfield Infrastructure Partners L.P. (BIP)
5-year expected annual returns: 10.7%
Distribution yield: 4.4%
Brookfield Infrastructure Partners L.P. owns a diversified collection of utility, transport, midstream, and data-infrastructure assets.
Its global portfolio includes pipelines, transmission systems, railroads, ports, telecom towers, and data centers.
Many operations benefit from regulated or contracted revenue and inflation-linked pricing, reducing dependence on any single market.
First-quarter 2026 funds from operations increased 10% to $709 million, while FFO per unit rose to $0.90 from $0.82.
Organic growth remained near the high end of management’s 6% to 9% target range.
Data-infrastructure FFO increased 46%, and midstream FFO advanced 12%. Brookfield also commissioned more than $1.7 billion of capital projects during the quarter.
Capital recycling remains central to the strategy. Brookfield sells mature assets and redeploys the proceeds into businesses with better prospective returns, limiting the need for permanent equity issuance.
The partnership has secured about$1 billion of additional sale proceeds and continues to invest in opportunities such as its expanded relationship with Bloom Energy.
Its quarterly distribution increased 6% to $0.455 per unit, and management targets long-term annual distribution growth of 5% to 9%.
Distributions have grown at a compound annual growth rate of 9% over the last 15 years.
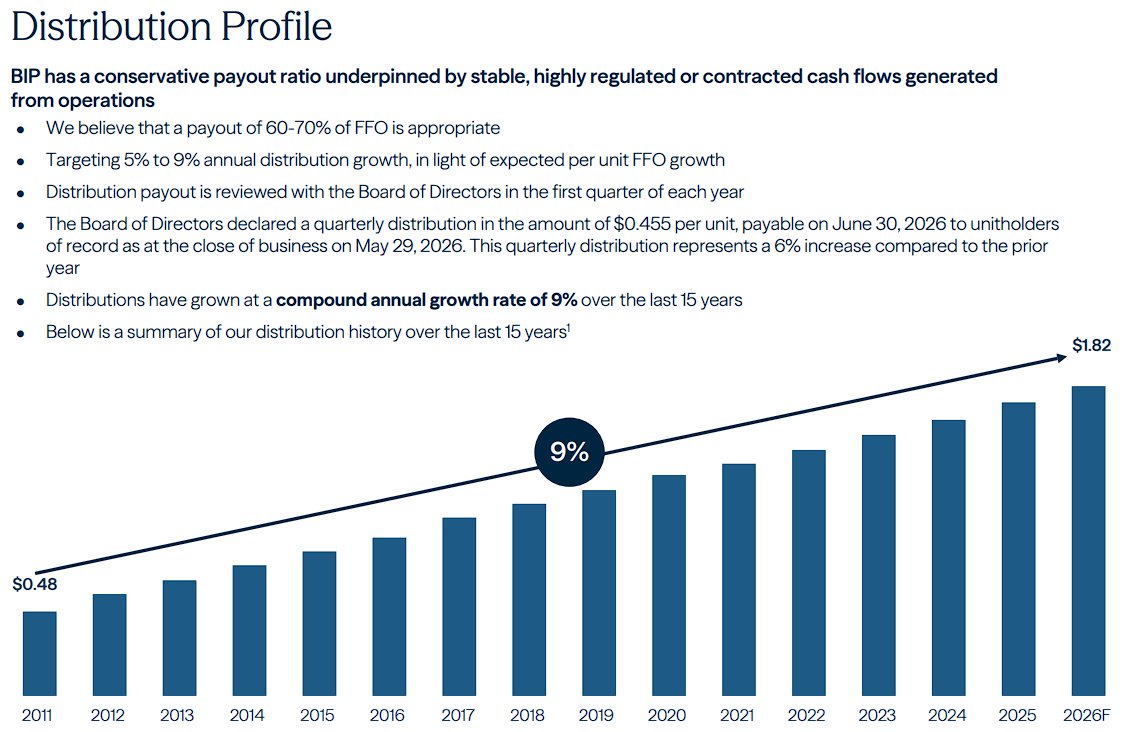
The global footprint provides diversification, although leverage, foreign exchange, economic sensitivity in some operations, and the tax considerations of a limited partnership add complexity.
Deep Dive: Click here to download (for free) our most recent 3-Page Sure Analysis PDF report on BIP.
MLP #2: Brookfield Renewable Partners L.P. (BEP)
5-year expected annual returns: 10.9%
Distribution yield: 4.8%
Brookfield Renewable Partners L.P. operates one of the world’s largest publicly traded renewable-power platforms.
Its portfolio spans hydroelectric, wind, solar, distributed energy, storage, and nuclear-services assets.
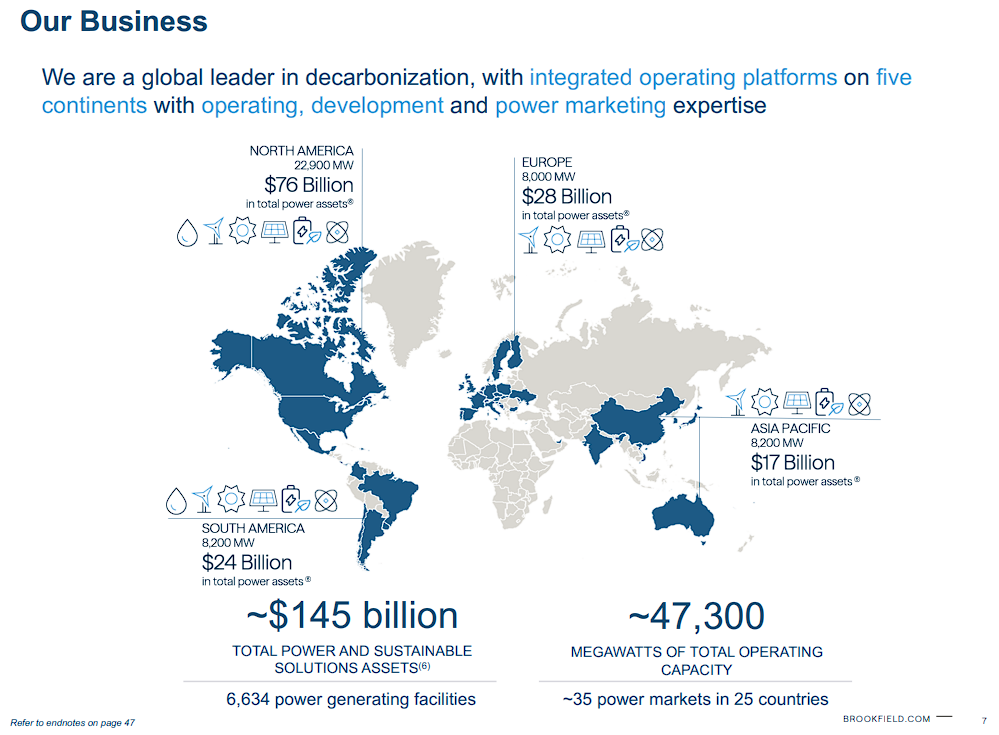
Long-term contracts and inflation-linked pricing provide recurring cash flow, while Brookfield’s access to institutional capital supports acquisitions and development.
First-quarter 2026 funds from operations increased 19% to $375 million.
FFO per unit rose 15% to $0.55, supported by strong generation and contributions from recent investments.
Hydroelectric FFO grew nearly 30%, while combined wind and solar FFO advanced approximately 60%.
The partnership nevertheless reported a net loss attributable to unitholders, reflecting depreciation and other accounting items that make FFO more useful than GAAP income for evaluating its operating performance.
Brookfield Renewable continues to fund growth by selling mature assets. It announced nearly $3 billion of sale agreements during the quarter while advancing development projects and acquisitions, including the proposed purchase of Boralex.
This approach can create value when assets are sold at attractive prices, and the proceeds are reinvested at better returns.
The distribution offers a meaningful starting yield with long-term growth potential.
Still, you must consider leverage, interest rates, currency movements, project execution, variable generation, and the tax complexity associated with owning a limited partnership.
Deep Dive: Click here to download (for free) our most recent 3-Page Sure Analysis PDF report on BEP.
MLP #1: Global Partners LP (GLP)
5-year expected annual returns: 11.0%
Distribution yield: 6.3%
Global Partners LP operates an integrated fuel-distribution, terminal, and convenience-store platform.
Its network includes 54 liquid-energy terminals and approximately 1,700 owned, leased, or supplied fueling locations, primarily in the Northeast, Mid-Atlantic, and Texas.
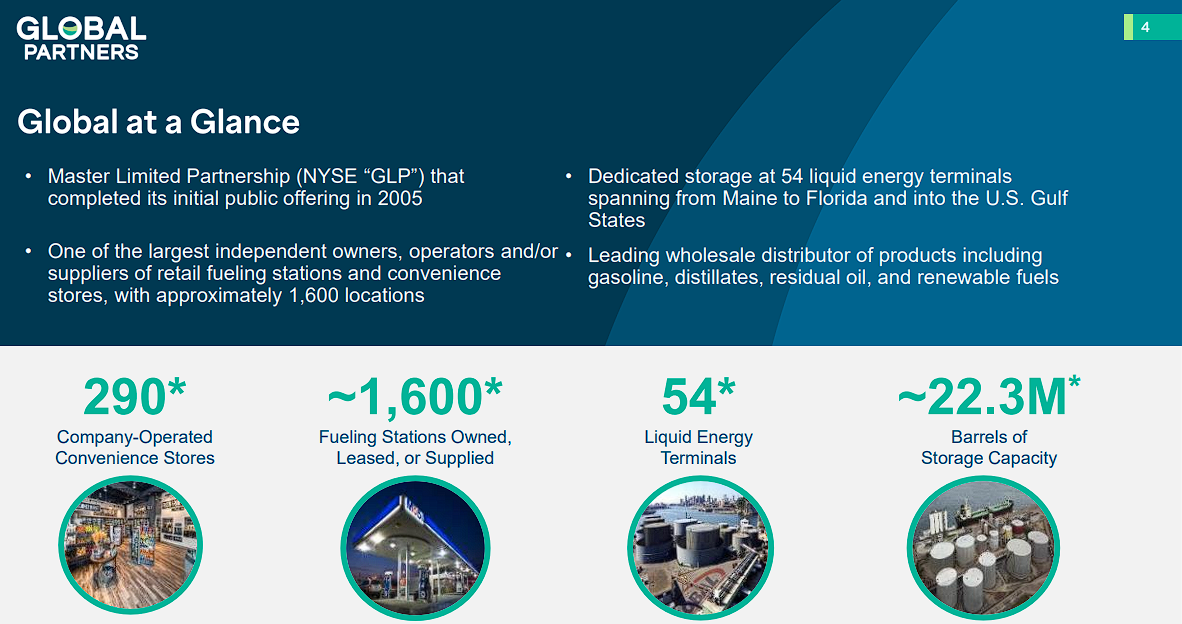
The combination of wholesale logistics and retail operations gives Global several sources of margin, but results remain sensitive to market conditions.
First-quarter 2026 sales increased to $5.3 billion from $4.6 billion as total volume rose to 2.1 billion gallons. Net income climbed to $70.1 million, or $1.85 per diluted unit, from $18.7 million, or $0.36 per unit.
Adjusted EBITDA increased to $140.4 million from $91.3 million, while adjusted distributable cash flow more than doubled to $96.8 million.
Wholesale margins benefited from favorable gasoline and residual-oil conditions, and gasoline-distribution margins also improved.
The strong quarter demonstrates the earnings power of Global’s terminal and distribution network, although investors should not assume that unusually favorable wholesale margins will persist indefinitely.
Management continues to expand and optimize its retail and logistics footprint, using acquisitions to add scale and improve asset utilization.
The quarterly distribution was $0.765 per unit, or $3.06 annualized.
Global offers the highest expected return in the ranking, but that estimate comes with an F Dividend Risk Score.
Margin volatility, leverage, acquisition execution, and exposure to changing fuel demand all warrant close monitoring.
Deep Dive: Click here to download (for free) our most recent 3-Page Sure Analysis PDF report on GLP.
MLP ETFs, ETNs, & Mutual Funds
There are 3 primary ways to invest in MLPs:
By investing in units of individual publicly traded MLPs
By investing in a MLP ETF or mutual fund
By investing in a MLP ETN
Note: ETN stands for “exchange traded note”
The difference between investing directly in a company (normal stock investing) versus investing in a mutual fund or ETF is very clear. It is simply investing in one security versus a group of securities.
ETNs are different. Unlike mutual funds or ETFs, ETNs don’t actually own any underlying shares or units of real businesses.
Instead, ETNs are financial instruments backed by the financial institution (typically a large bank) that issued them. They perfectly track the value of an index.
The disadvantage to ETNs is that they expose investors to the possibility of a total loss if the backing institution were to go bankrupt.
The advantage to investing in a MLP ETN is that distribution income is tracked, but paid via a 1099. This eliminates the tax disadvantages of MLPs (no K-1s, UBTI, etc.).
This unique feature may appeal to investors who don’t want to hassle with a more complicated tax situation. The J.P. Morgan Alerian MLP ETN (AMJB) makes a good choice in this case.
Purchasing individual securities is preferable for many, as it allows investors to concentrate on their best ideas. But ETFs have their place as well, especially for investors looking for diversification benefits.
Final Thoughts
Master Limited Partnerships are a misunderstood asset class. They offer diversification, tax-advantaged and tax-deferred income, high yields, and have historically generated excellent total returns.
The asset class is likely under-appreciated because of its more complicated tax status.
Our rankings should be treated as a research shortlist, not necessarily a buy list.
Expected returns depend on growth and valuation assumptions that can change as unit prices, commodity markets, and capital plans evolve.
We believe you should compare distribution coverage, leverage, contract quality, customer concentration, and management’s record of allocating capital before purchasing any MLP.
The structure also matters.
PAA and PAGP provide exposure to essentially the same business, while Star Group has elected corporate tax treatment and the Brookfield partnerships adds foreign-tax and currency considerations.
The highest projected return is not automatically the lowest-risk choice.
Enterprise Products and Brookfield Infrastructure carry stronger Dividend Risk Scores than several higher-ranked names, while Global Partners, Hess Midstream, and Delek Logistics offer more income alongside greater business or financial risk.
Finally, MLP tax reporting can be complicated and may not suit every account. You should understand the potential K-1, UBTI, state-filing, and withholding consequences before buying.
Hiring a tax professional to aid in preparing taxes may be a worthwhile option for dealing with the complexity.
Additionally, MLPs are not the only way to find high levels of income. The following lists contain many more stocks that regularly pay rising dividends.
The Dividend Aristocrats List: 69 stocks in the S&P 500 Index with 25+ years of consecutive dividend increases.
The Dividend Kings List is even more exclusive than the Dividend Aristocrats. It is comprised of 55 stocks with 50+ years of consecutive dividend increases.
The High Dividend Stocks List: stocks that appeal to investors interested in the highest yields of 5% or more.
The Monthly Dividend Stocks List: stocks that pay dividends every month, for 12 dividend payments per year.
Thanks for reading this article. Please send any feedback, corrections, or questions to [email protected].