Let’s talk about my recent weekend trade.
What turns a chart that looks like THIS…
Source: Stocks To Trade
Mystery ticker, 6-month, daily candle, weekend trade candidate.
Into a stock that I’d want to trade (ESPECIALLY before those green candles the last two days)?
Talk about beaten down, right?
Not only did I trade it, I held it over a long weekend.
And it played out almost exactly like I thought it would.
Why Trade a Beaten-Down AI Stock?
On Thursday (July 2), Yiren Digital Ltd. (YRD) announced its board of directors had authorized a share repurchase program for up to $20 million over the next 12 months.
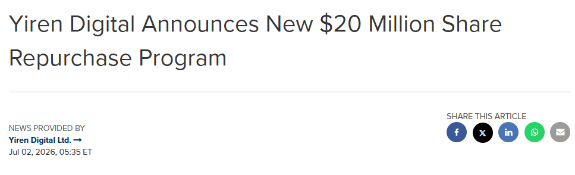
Source: Yiren Digital Ltd. via PR Newswire
Now, why does a share repurchase matter?
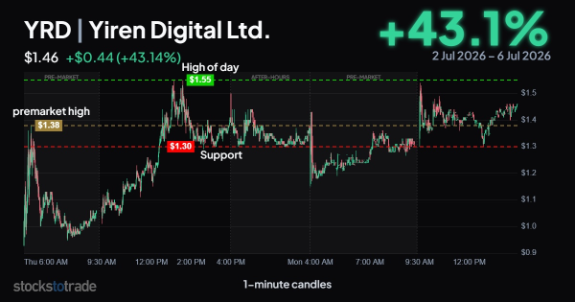
On a purely technical level, first, there was an initial spike on the news.
YRD faded into the open, but there was a nice breakout over the premarket highs in the early afternoon, where it set a new high of the day.
Source: Stocks To Trade
YRD, 7/2/26 to 7/6/26, 1-min candle, premarket highs became morning resistance.
As you can see, the premarket highs became the morning resistance. After the breakout, the $1.30s became support.
So, my question was…
Can It Have a Second Leg?
I liked that YRD was holding right near the morning spike highs.
Remember, former resistance becomes support. So, theoretically, it wasn’t likely to dip below the $1.30s.
But what if I was wrong?
I would have followed rule #1: cut losses quickly. At the lowest. I might have cut in the $1.20s if it dipped too quickly.
Long story short, I liked the risk vs. reward.
When I bought at $1.37, I was risking roughly $0.10 per share.
If I was right and there was another leg up, I figured it could retest the high of the day at $1.55.
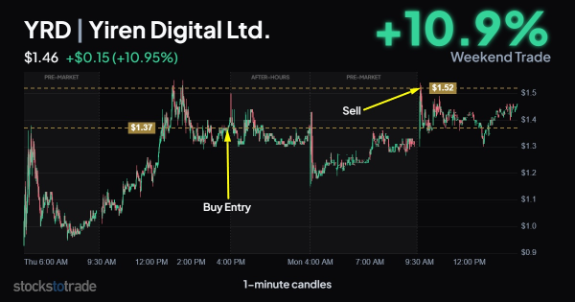
Source: Stocks To Trade
YRD, 7/2/26 to 7/6/26, 1-min candle, weekend trade with catalyst.
I didn’t think the stock could get back to where it was trading in March (the $3s), but I did think there was 10%-20% of upside over the weekend.
YRD had a nice little spike at the open. I decided to lock in the single because it wasn’t taking out last week’s high.
Let’s dig a little deeper into the catalyst, because again, a few months ago, YRD was in the $3s.
Then, this happened…
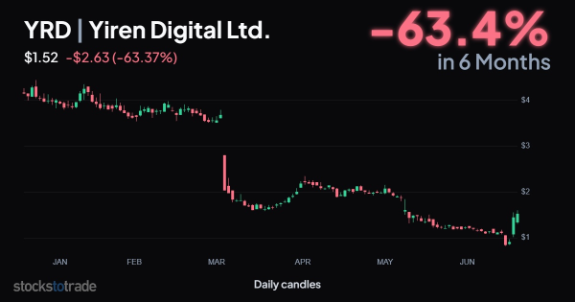
Source: Stocks To Trade
YRD, 6-month, daily candle.
When you see price action like that, it’s very important to…
Understand What Causes Spikes and Dips
YRD dropped 44% in one day because the company had weak Q4 results and suspended its dividend.
The article went on to say the dividend suspension:
“directly challenges the earlier income-and-growth narrative and brings balance sheet resilience and credit risk management to the forefront. Short-term catalysts now hinge less on headline growth and more on evidence that credit costs are under control […].”
Fast forward a few months and there is a clear momentum shift.
Before it suspended the dividend, the company was trying to conserve cash.
Now, the company is spending cash to buy back its own shares.
Why is the company repurchasing shares if it is so worried about cash or bankruptcy (which is what the market was pricing)?
That tells me (and anyone paying attention) that they have enough cash to weather the storm.
And THAT means the stock could have a multi-day runup.
Finding Momentum in Friday-Monday Trades
On a trade like YRD, it doesn’t matter whether I make $0.10 to $0.20 a share…
Get a full move up to the $2s … or lose $0.10 to $0.15 a share.
The most important thing is to understand why the stock was moving and set a smart risk level and goals.
Because of the share repurchase program, and knowing why the stock dropped when the company didn’t have enough cash…
That told me that there was a clear momentum shift.
In the end, it turned out to be a single.
That said, it closed on July 6, right at the price where I sold, so there may be another leg.
For more weekend trade ideas, check out my presentation here … before the market closes today and you miss the next opportunity.
Cheers,
 Tim SykesEditor, Tim Sykes Daily